
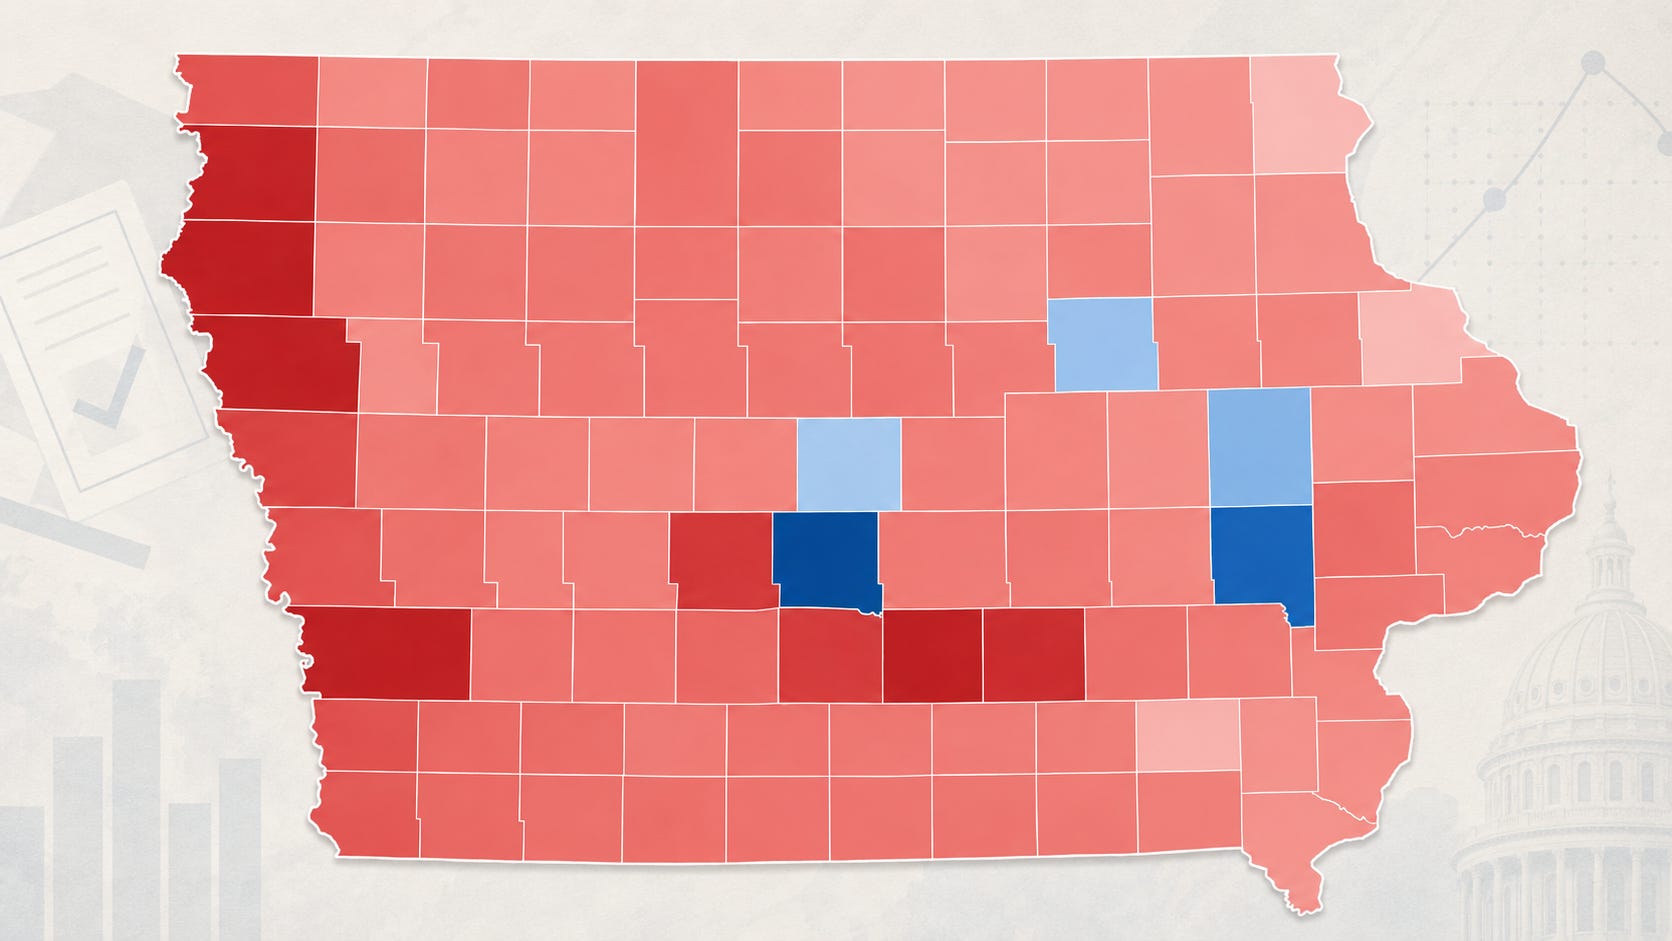
Even with Democrat gains, Iowa still looks red
Democrats had their best post-primary month since 2018, but Iowa’s active voter rolls are far more Republican than they were then.
Iowa’s July 2026 voter registration numbers give Democrats a short-term bright spot and a much larger problem.
From June to July, Democrats gained more active voters than Republicans. That is a change from the post-primary movement in 2022 and 2024. But measured from 2014, 2018, 2020, or the last midterm in 2022, Iowa’s active voter rolls are far more Republican than they used to be.
The statewide and county comparisons below go back to 2014. For congressional districts, the pre-2022 numbers use county-level registration data grouped according to the current congressional district map. For Iowa House and Iowa Senate districts, I limit the comparison to 2022 through 2026 because of redistricting.
Iowa changed how active voter rolls are maintained
Any comparison of Iowa’s active voter rolls before and after 2020 needs one piece of context: the 2021 election law.
Senate File 413 changed Iowa’s voter-list maintenance process. Before the law, the relevant notice process applied to voters who had not voted in two or more consecutive general elections. The 2021 law changed that trigger to voters who had not voted in the most recent general election, had not registered again, had not reported a change to an existing registration, and had not responded to a notice. Voters receiving such a notice are marked inactive.
That change shows up clearly after the 2022 mid-term general election. In July 2022, Iowa had 1,849,355 active registered voters and 368,101 inactive registered voters. In July 2024, ahead of the 2024 general election, active registrations had fallen to 1,546,046 while inactive registrations had climbed to 670,819. The grand total barely moved.
That does not mean Iowa suddenly lost 300,000 voters between 2022 and 2024. Many voters moved from active to inactive under the new maintenance rules after not voting in the 2022 general election. By July 2026, active registration had rebounded to 1,807,752 and inactive registration had fallen to 344,997.
For that reason, the cleanest midterm-to-midterm comparison is 2022 to 2026. The 2024 numbers are still useful, but they have to be considered with the 2021 law in mind.
The statewide shift
Republican and Democrat active registered voter rolls were much, much closer through 2020 than they are now.
In July 2014, Republicans led Democrats statewide by 16,192 active voters. In July 2016, the Republican edge grew to 34,139. In July 2018, it narrowed to 24,439. In July 2020, Republicans led Democrats by only 641 active voters.
After 2020, the gap widened quickly.
By July 2022, Republicans led Democrats by 84,751 active voters. By July 2026, the Republican advantage had grown to 183,912.
Compared with July 2022, Republicans gained 29,716 active voters. Democrats lost 69,445. No Party voters were nearly unchanged, down 679. The Republican-over-Democratic active-registration advantage increased by 99,161 active voters in four years.
No Party voters also moved ahead of Democrats. In July 2024, Democrats still had 14,769 more active voters than No Party voters. By July 2026, No Party voters outnumbered Democrats by 27,634.
The post-2020 shift is the central point. Iowa did not spend the last decade sitting on a six-figure Republican registration advantage. That advantage opened up after 2020 and remains large in 2026.
Democrats had a better post-primary month
The June-to-July movement gives Democrats something they have not had in recent cycles: a better post-primary registration month than Republicans.
From the June pre-primary report to the July post-primary report, Democratic active registration rose from 500,432 to 527,675, a gain of 27,243. Republican active registration rose from 694,349 to 711,587, a gain of 17,238. That narrowed the Republican-over-Democratic active-registration edge from 193,917 in June to 183,912 in July.
That is a different pattern from 2022 and 2024.
In 2022, the Republican-over-Democratic active-registration margin widened by 19,369 from June to July. In 2024, it widened by 15,504. In 2026, it narrowed by 10,005.
The better historical comparison is 2018. From June to July 2018, Democrats gained 24,189 active voters, Republicans gained 3,479, and No Party voters fell by 23,249. The Republican-over-Democratic margin narrowed by 20,710 in one month.
The 2026 movement is the closest thing to that since 2018. Democrats gained more active voters than Republicans, and No Party active registration fell by 32,700. That makes sense in a primary month. Iowa holds closed primaries, and No Party voters who want to participate in a party primary have to affiliate with a party and change their registration.
But the starting point is very different. In July 2018, Republicans led Democrats statewide by 24,439 active voters. In July 2026, they led by 183,912. Republicans also gained 13,759 more registered active voters in 2026 than they did in 2018.
Democrats had a good post-primary month. They are still starting from a much deeper hole than they faced in 2018.
Today’s congressional districts looked different in 2018
Because Iowa’s congressional districts changed after the 2020 census, the pre-2022 congressional comparison below uses county-level data grouped according to the current district map used in the Secretary of State’s 2026 congressional district data. For 2022, 2024, and 2026, the comparison uses the Secretary of State’s congressional district data directly.
Using today’s district footprints, Iowa’s 1st Congressional District had a Democratic active-registration advantage of 21,833 in July 2018. By July 2026, Republicans led by 22,484. That is a 44,317-voter shift toward Republicans on the active Republican-minus-Democratic margin.
Iowa’s 2nd Congressional District had a Democratic advantage of 16,855 in July 2018. By July 2026, Republicans led by 26,947. That is a 43,802-voter shift toward Republicans.
Iowa’s 3rd Congressional District had a Democratic advantage of 10,124 in July 2018. By July 2026, Republicans led by 17,031. That is a 27,155-voter shift toward Republicans.
Iowa’s 4th Congressional District was already Republican by active registration. The Republican advantage grew from 73,251 in July 2018 to 117,450 in July 2026, a 44,199-voter shift toward Republicans.
The 2020 comparison is even sharper. Using today’s district footprints, Democrats had active-registration advantages in Iowa’s 1st Congressional District, Iowa’s 2nd Congressional District, and Iowa’s 3rd Congressional District in July 2020. Republicans led only in Iowa’s 4th Congressional District. By July 2026, Republicans led in all four.
The post-primary movement in 2026 resembles 2018 in one limited way. In 2018, the June-to-July movement went toward Democrats in all four current congressional district footprints. In 2026, it moved toward Democrats in Iowa’s 1st Congressional District, Iowa’s 2nd Congressional District, and Iowa’s 3rd Congressional District. Iowa’s 4th Congressional District moved slightly toward Republicans.
That is the congressional district comparison in plain terms: Democrats had a better post-primary month than they had in 2022 or 2024, but today’s districts are working from a much more Republican registration base than they had in 2018.
The county map moved right
The county-level data gives the cleanest long-term comparison because county lines avoid the redistricting problem.
In July 2014, Republicans had more active voters than Democrats in 73 counties. Democrats had more active voters than Republicans in 26. By July 2018, Republicans led Democrats in 76 counties. By July 2020, they led in 77. By July 2026, Republicans led Democrats in 94 counties. Democrats led in only five: Black Hawk, Johnson, Linn, Polk, and Story.
No Party voters were also much stronger county-by-county in the earlier period. In July 2014, No Party voters were the largest active-registration group in 46 counties. In July 2018, they were still the largest group in 43 counties. By July 2026, No Party voters were the largest active group in only six counties.
From July 2014 to July 2026, the active Republican-minus-Democratic margin moved toward Republicans in 92 of Iowa’s 99 counties. The seven exceptions were Johnson, Polk, Story, Dallas, Montgomery, Cass, and Osceola.
The largest rightward shifts came in counties Democrats used to rely on. Dubuque moved 10,206 voters toward Republicans on the active Republican-minus-Democratic margin. Woodbury moved 6,876. Lee moved 6,661. Scott moved 6,168. Des Moines moved 5,979. Webster moved 5,861. Wapello moved 5,602. Clinton moved 5,462. Black Hawk moved 5,429. Jasper moved 4,483.
Twenty-one counties moved from a Democratic edge over Republicans in July 2014 to a Republican edge by July 2026: Buchanan, Carroll, Cerro Gordo, Chickasaw, Clayton, Clinton, Davis, Des Moines, Dubuque, Emmet, Floyd, Howard, Jackson, Jasper, Lee, Monona, Monroe, Palo Alto, Scott, Wapello, and Webster.
That list is not limited to western Iowa or already-red rural counties. It includes eastern Iowa, places that once helped Democrats build statewide margins.
House and Senate districts moved right after redistricting
The Iowa House and Iowa Senate comparisons are limited to 2022 through 2026 because of redistricting.
In the Iowa House, 99 of 100 districts moved toward Republicans on the active Republican-minus-Democratic margin from July 2022 to July 2026. The lone exception was House District 18, where the massive Republican edge narrowed slightly by 101 active voters. This does not mean Republicans now lead in nearly every House district, but it does mean the active registered voter margin moved in their direction almost everywhere.
Four House districts moved from a Democratic active-registration plurality in 2022 to a Republican plurality in 2026: House District 25, House District 40, House District 52, and House District 100. Those shifts were already visible in the July 2024 snapshot. Several other House districts moved from Democratic plurality to No Party plurality.
The June-to-July 2026 comparison was more favorable to Democrats. From the pre-primary report to the post-primary report, the active Republican-minus-Democratic margin moved toward Democrats in 68 of 100 House districts. That is a short-term improvement, but it does not erase the broader 2022-to-2026 movement.
The Iowa Senate moved the same way over the four-year comparison. Across all 50 Senate districts, the active Republican-minus-Democratic margin moved toward Republicans from July 2022 to July 2026.
Among the odd-numbered Senate districts up in 2026, there were no Democratic-to-Republican active plurality flips between 2022 and 2026. Two moved from No Party plurality to Republican plurality: Senate District 35 and Senate District 41. Both changes were already visible in the July 2024 snapshot.
The June-to-July Senate numbers were better for Democrats. The active Republican-minus-Democratic margin moved toward Democrats in 31 of 50 Senate districts. Like the House numbers, that is a better one-month movement for Democrats, not a reversal of the longer trend.
The 2018 comparison only goes so far
The 2026 post-primary movement was Democrats’ best since 2018. It deserves attention.
But 2026 is not 2018.
In July 2018, Republicans led Democrats statewide by 24,439 active voters. In July 2026, they led by 183,912. Using today’s congressional district footprints, Democrats had active-registration advantages in Iowa’s 1st Congressional District, Iowa’s 2nd Congressional District, and Iowa’s 3rd Congressional District in 2018. By July 2026, Republicans led in all four.
The county map has shifted as well. In 2018, Republicans had an active-registration edge over Democrats in 76 counties. In 2026, they had one in 94.
The June-to-July numbers give Democrats their best primary month registration movement in years. The longer trend shows how much ground they have lost since Iowa’s last Democratic-friendly midterm.
If you find what you are reading interesting and you are not currently a subscriber, please consider subscribing.


